In QGIS, print maps and images are constructed using a print composer.
- Create a print composition
From the main menu, select Project >> New Print Composer.
- A dialog will pop up asking for a title. I'll enter Chicago Crime Map.
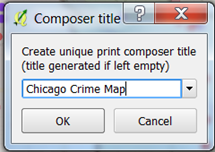
The Print Composer will open in a separate window.
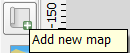
2. Add a map
From the main menu of the Print Composer, select Layout >> Add Map or click the Add new map button:
Then click and drag to place a map frame on the composer. The map will appear as in the main QGIS window:
3. Set the map scale and extent
Interactive zooming is not available in print composer, so we'll need to change the map scale by hand.
- In the Item panel (top right), make sure the map is selected.
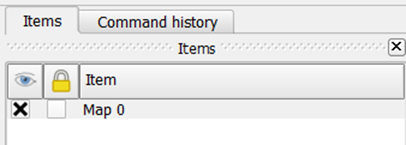
- In the bottom right, select the Item Properties tab
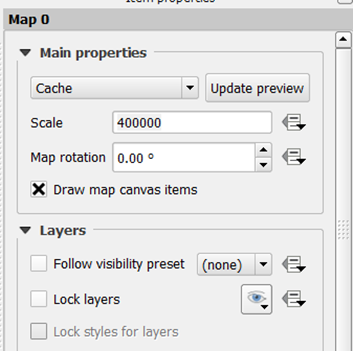
- Find the scale property and enter a value of 400,000 to zoom to a scale of 1:400,000.
4. Pan to chicago
Interactive panning is available, but needs to be enabled:
- From the main menu, select Layout >> Move Content
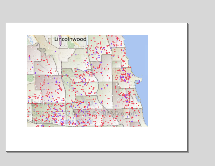
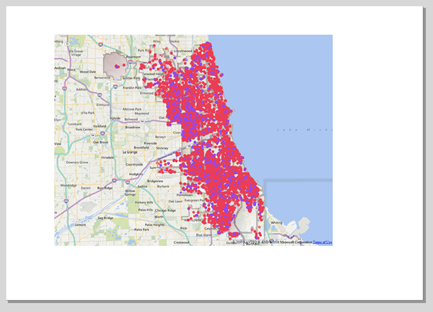
- You can now use your mouse to pan the map. Here's what mine looks like:
5. Adjust symbology
You can adjust your symbology at any time. For example, to make your point symbols smaller:
- Go back to the main map and change the symbol size
- Back in Print Composer, click Update preview (in the Item Properties tab)
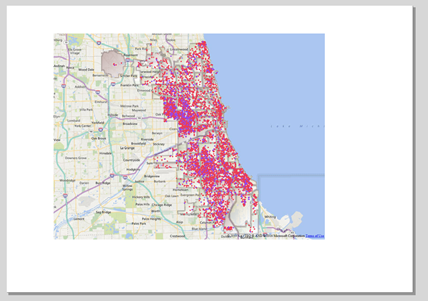
Here's my map after reducing the symbol size:
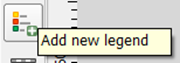
6. Add a legend
To add a legend, select Layout >> Add Legend or click the Add new legend button:
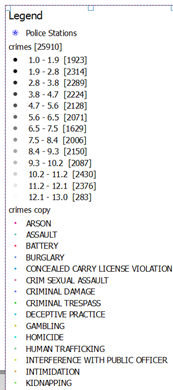
Then draw a rectangle on the print composer. The legend will probably contain way too much information:
7. Modify the legend
Luckily it's really easy to remove items from a legend:
- Select the legend
- Select the Item Properties tab in the lower right panel.
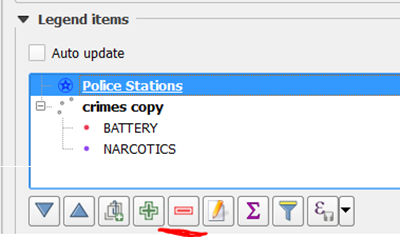
- In the Legend Items group, uncheck Auto update.
- Select an item you wish to remove and click the minus-sign.
8. Add a Grid
It's also really easy to add a grid to a map:
- Select the map
- In the Item properties panel, look for the Grids section:
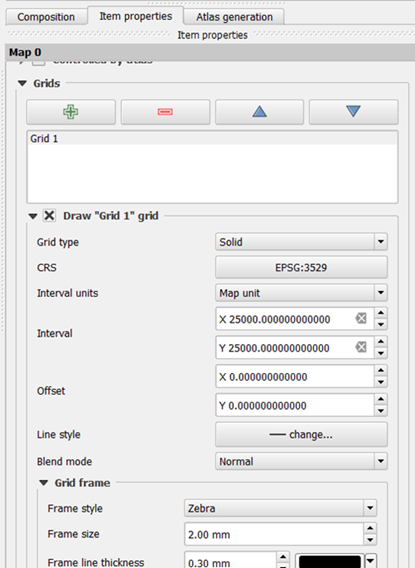
- Click the green plus sign to add a grid.
- Set the Coordinate Reference System (CRS) if necessary.
- I've chosen choose Illinois State Plane East (EPSG 3529)
- Set the grid intervals as appropriate
- The units of Illinois State Plane East is meters
- I've chosen a grid spacing of 25km (=25,000 meters)
- Adjust other parameters as desired
9. Etcetera
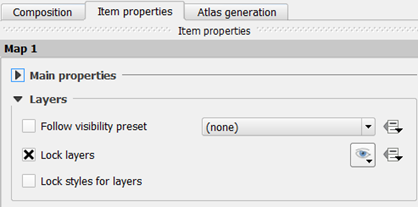
- One of the most useful options is to Lock layers on a map. This allows you to create another map in print composer with different layer visibility and symbology.
- To group items, select the items you want to group and select Layout >> Group or press Ctrl-G on your keyboard.
- QGIS has a smart guides feature which allows you to align objects as you move them around.
- Unfortunately, QGIS does not have compass roses or other North Arrow symbols (but a simple north arrow can be created manually).
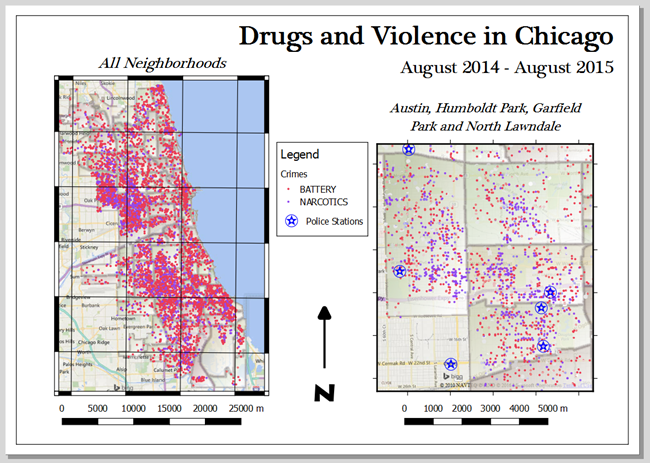
Here's an example of a map created in Print Composer:
Try it out yourself to see what maps you can make. QGIS does a good job here, the possibilities are endless.